Rangeland Management Applications
Background:
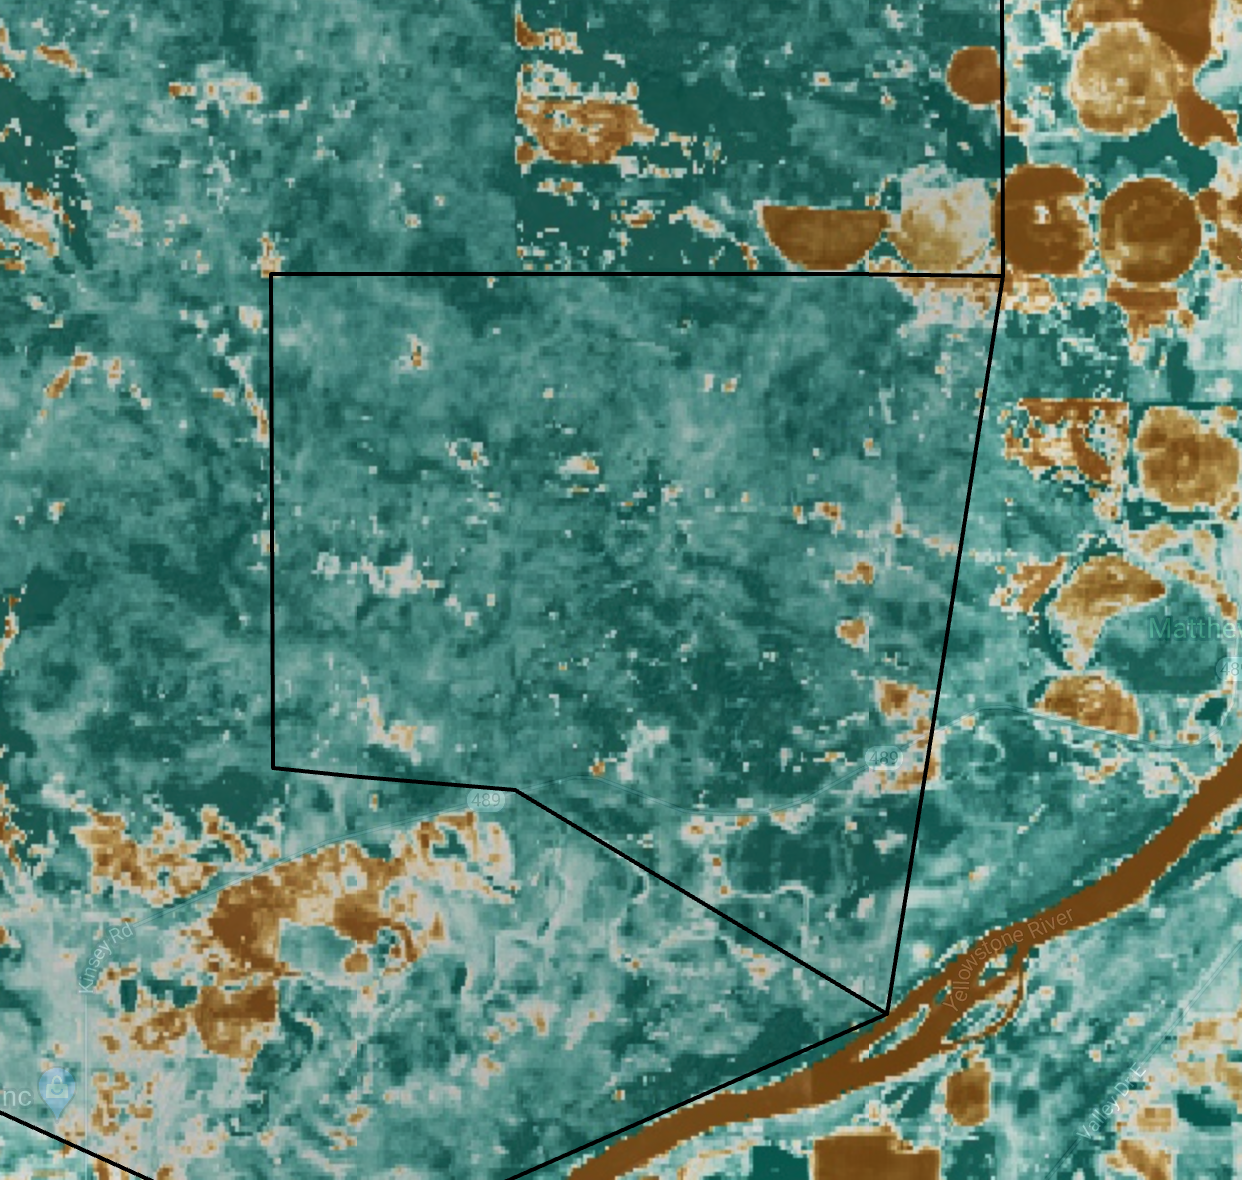
Forage availability can vary substantially from year-to-year, but accounting for forage quantity, interannual variability, and the climate drivers at the landscape scale has remained out of reach for many resource managers. Here, we’ll assess forage availability and variability using the Rangeland Analysis Platform and drought drivers for the Wohlgenant Lease north of Miles City, Montana. For this demonstration, we’ll pretend that it is June 10, 2023.
Link to location: https://climengine.page.link/BVku
Workflow for the Wohlgenant Lease area:
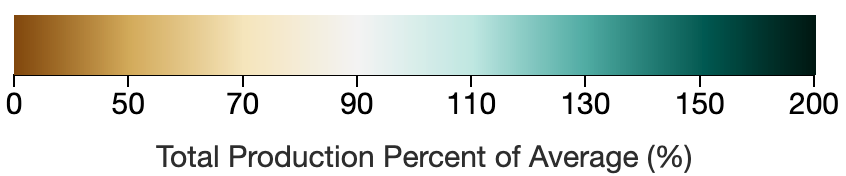
- Map the average (1986-2022) total herbaceous production from RAP.
- Map the trend in (1986-2022) total herbaceous production from RAP.
- Map the current year’s total herbaceous production through June 10 from RAP 16-day production.
- https://climengine.page.link/EhJa
- Map the current year’s total herbaceous production through June 10 from RAP 16-day production as a percent of average anomaly relative to 2000-2022.
- https://climengine.page.link/Krie
- Graph timeseries for total herbaceous production through June 10 from RAP 16-day production from 2000-2023.
- https://climengine.page.link/RPPq
- Graph timeseries for total herbaceous production through June 10 from RAP 16-day production relative to the long-term drought blend from 2000-2023.
- https://climengine.page.link/JGNq
- Drought-production timeseries: https://climengine.page.link/hbPU
- Drought-production scatterplot: https://climengine.page.link/1eSt
Background:
The area near Schellbourne Pass has received substantial conifer management in recent years. The location listed below was chained in 2012 and we can use satellite-based vegetation data from RAP and RCMAP to investigate the post treatment response.
Location: 39° 48’ 15.76” N, 114° 36’ 35.66” W
Link to location: https://climengine.page.link/1Yyq
Workflow for the Schellbourne Pass area:
- Map current condition (2022) of tree cover from RAP.
- https://climengine.page.link/CKqf
- Map current condition (2022) of tree cover from RCMAP.
- https://climengine.page.link/AHLg
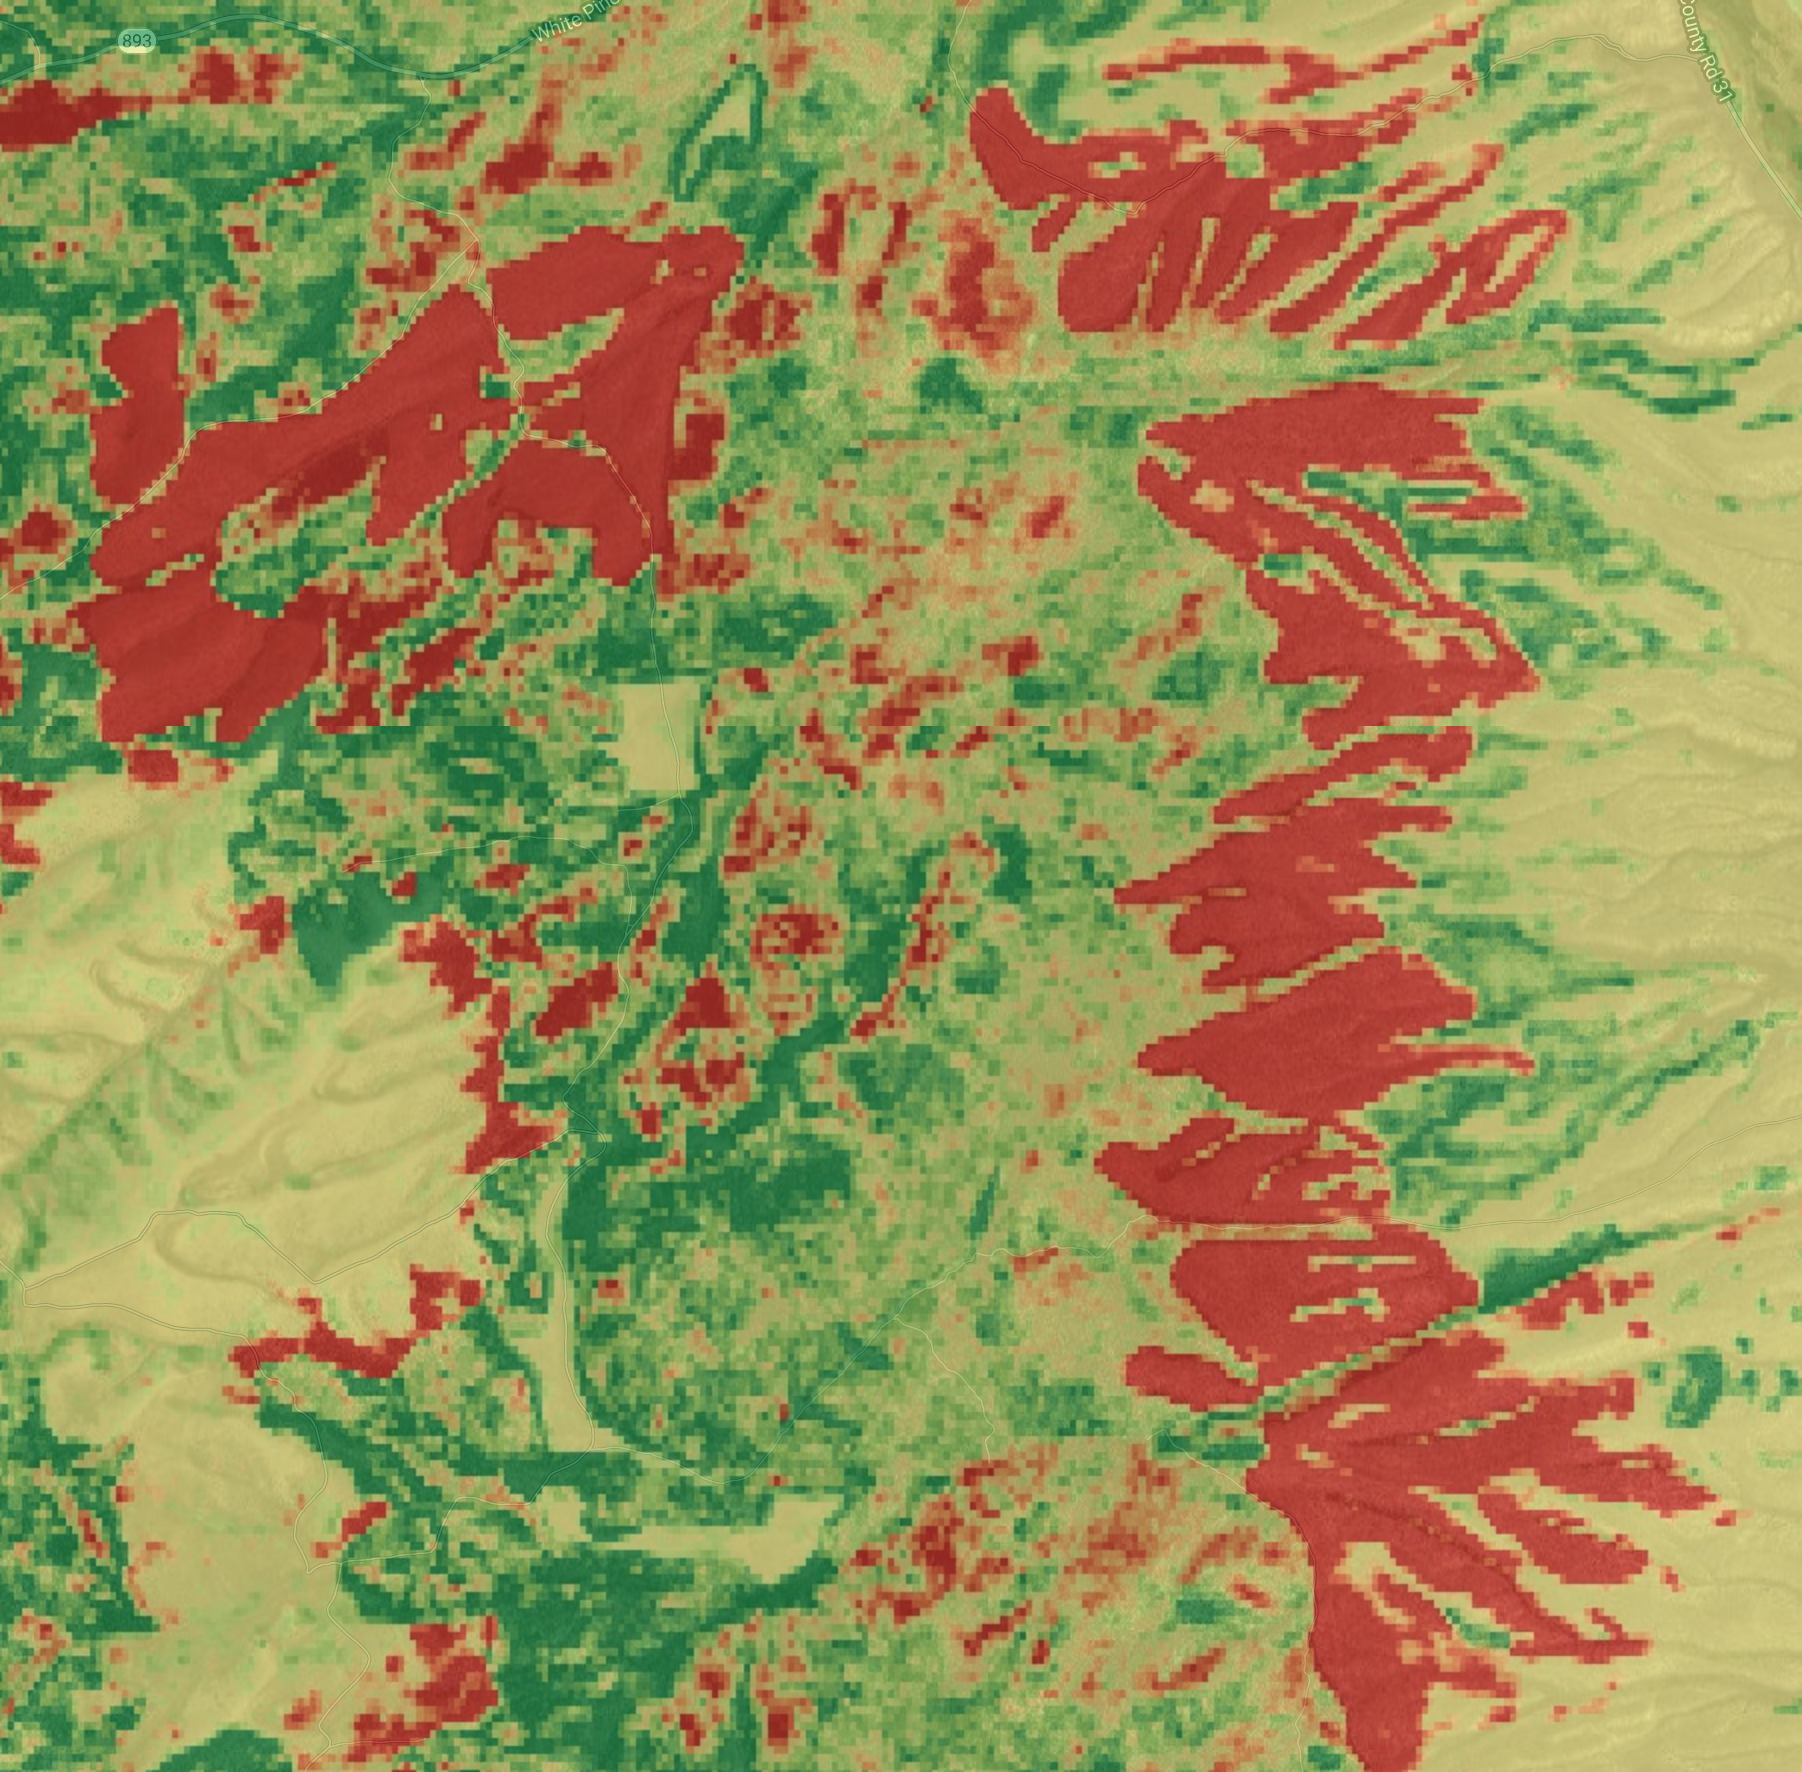
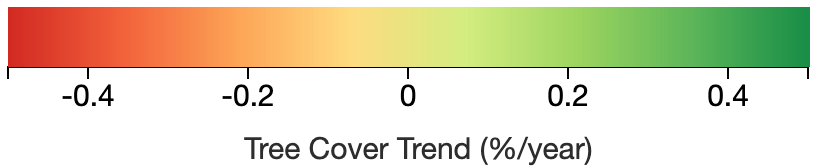
- Map slope of trend (1986-2022) of tree cover from RAP.
- https://climengine.page.link/b2GG
- Map slope of trend (1986-2022) of tree cover from RCMAP.
- https://climengine.page.link/XDHm
- Graph timeseries of tree cover and total herbaceous production from RAP from 1986-2022.
- https://climengine.page.link/XDHm
- Graph timeseries of annual herbaceous production and perennial herbaceous production from 1986-2022.
- https://climengine.page.link/sSZA
- Graph water year precipitation vs. RAP total herbaceous production
- https://climengine.page.link/d2DP
- Two time-period scatterplot between water year precipitation and RAP production: https://climengine.page.link/U7m4
Background:
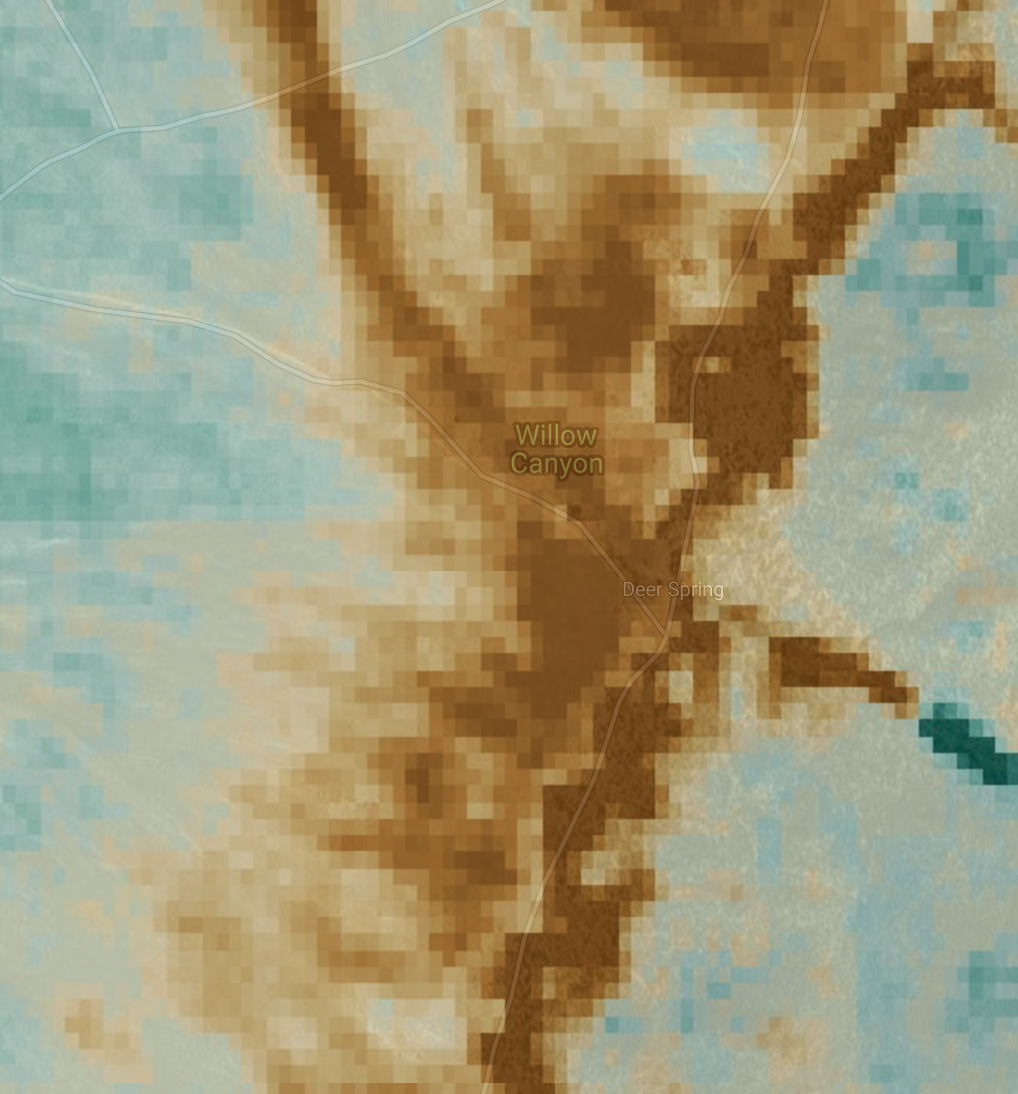
The appropriate management level for horse population is 155-249 horses in the Antelope Valley Horse Management Area, but in 1984 there were ~449 head and by 2021 there were ~1144 head reported; cattle have not been present since the 1980s. Managers have reported declines in the shrub component and increases in the annuals component of the vegetation community near Deer Spring associated with heavy horse usage. We’ll investigate current vegetation condition and trends in Antelope Valley Horse Management Area near Deer Spring using satellite-based vegetation data, while accounting for climate and drought.
Location: 40° 21’ 47.5” N, 114° 35’ 31.19” W
Ecological Site: Loamy 8-10” P.Z. (R028BY010NV)
Workflow for the Deer Spring area:
- Map current condition (2022) of shrub cover from RAP.
- Click here to find local area: https://climengine.page.link/nqbM
- https://climengine.page.link/8Etk
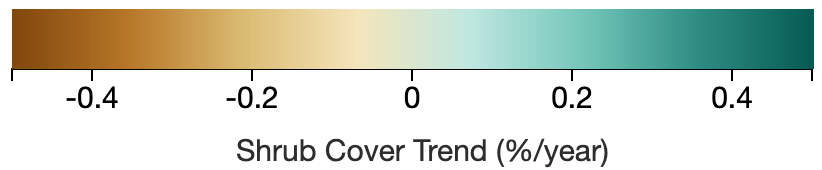
- Map the trend in shrub cover (1986-2022) from RAP.
- https://climengine.page.link/hWxo
- Map current condition (2022) of annual forb and grass cover from RAP.
- https://climengine.page.link/2sHs
- Map the trend in annual forb and grass cover (1986-2022) from RAP.
- https://climengine.page.link/5mCa
- Graph the timeseries of shrub and annual forb and grass cover from RAP for 1986-2022 for the local area.
- https://climengine.page.link/hi83
- Graph the timeseries of shrub from RAP and the long-term drought blend from GridMET from 1986-2022 to account for climate.
- https://climengine.page.link/d823
- Assess changes in upslope tree cover that could be impacting water availability as well.