Dive In & Make a Map!
Video Demonstration of Making a Map
Getting Started
To make a map with Climate Engine, first you need to Create a Free Account. Once you open the app at app.climateengine.org in your browser, select the Make Map tab. This tab shows an interactive panel. In this panel, there are 4 choices to make to obtain a map with Climate Engine. First, you need to select a product. Second, you need to select the kind of processing to perform on the dataset. Third, you have the option to pick a mask. Fourth, you need to select a time period of interest. Once you select those options, you can request a map by clicking the bottom button labeled Compute Map.
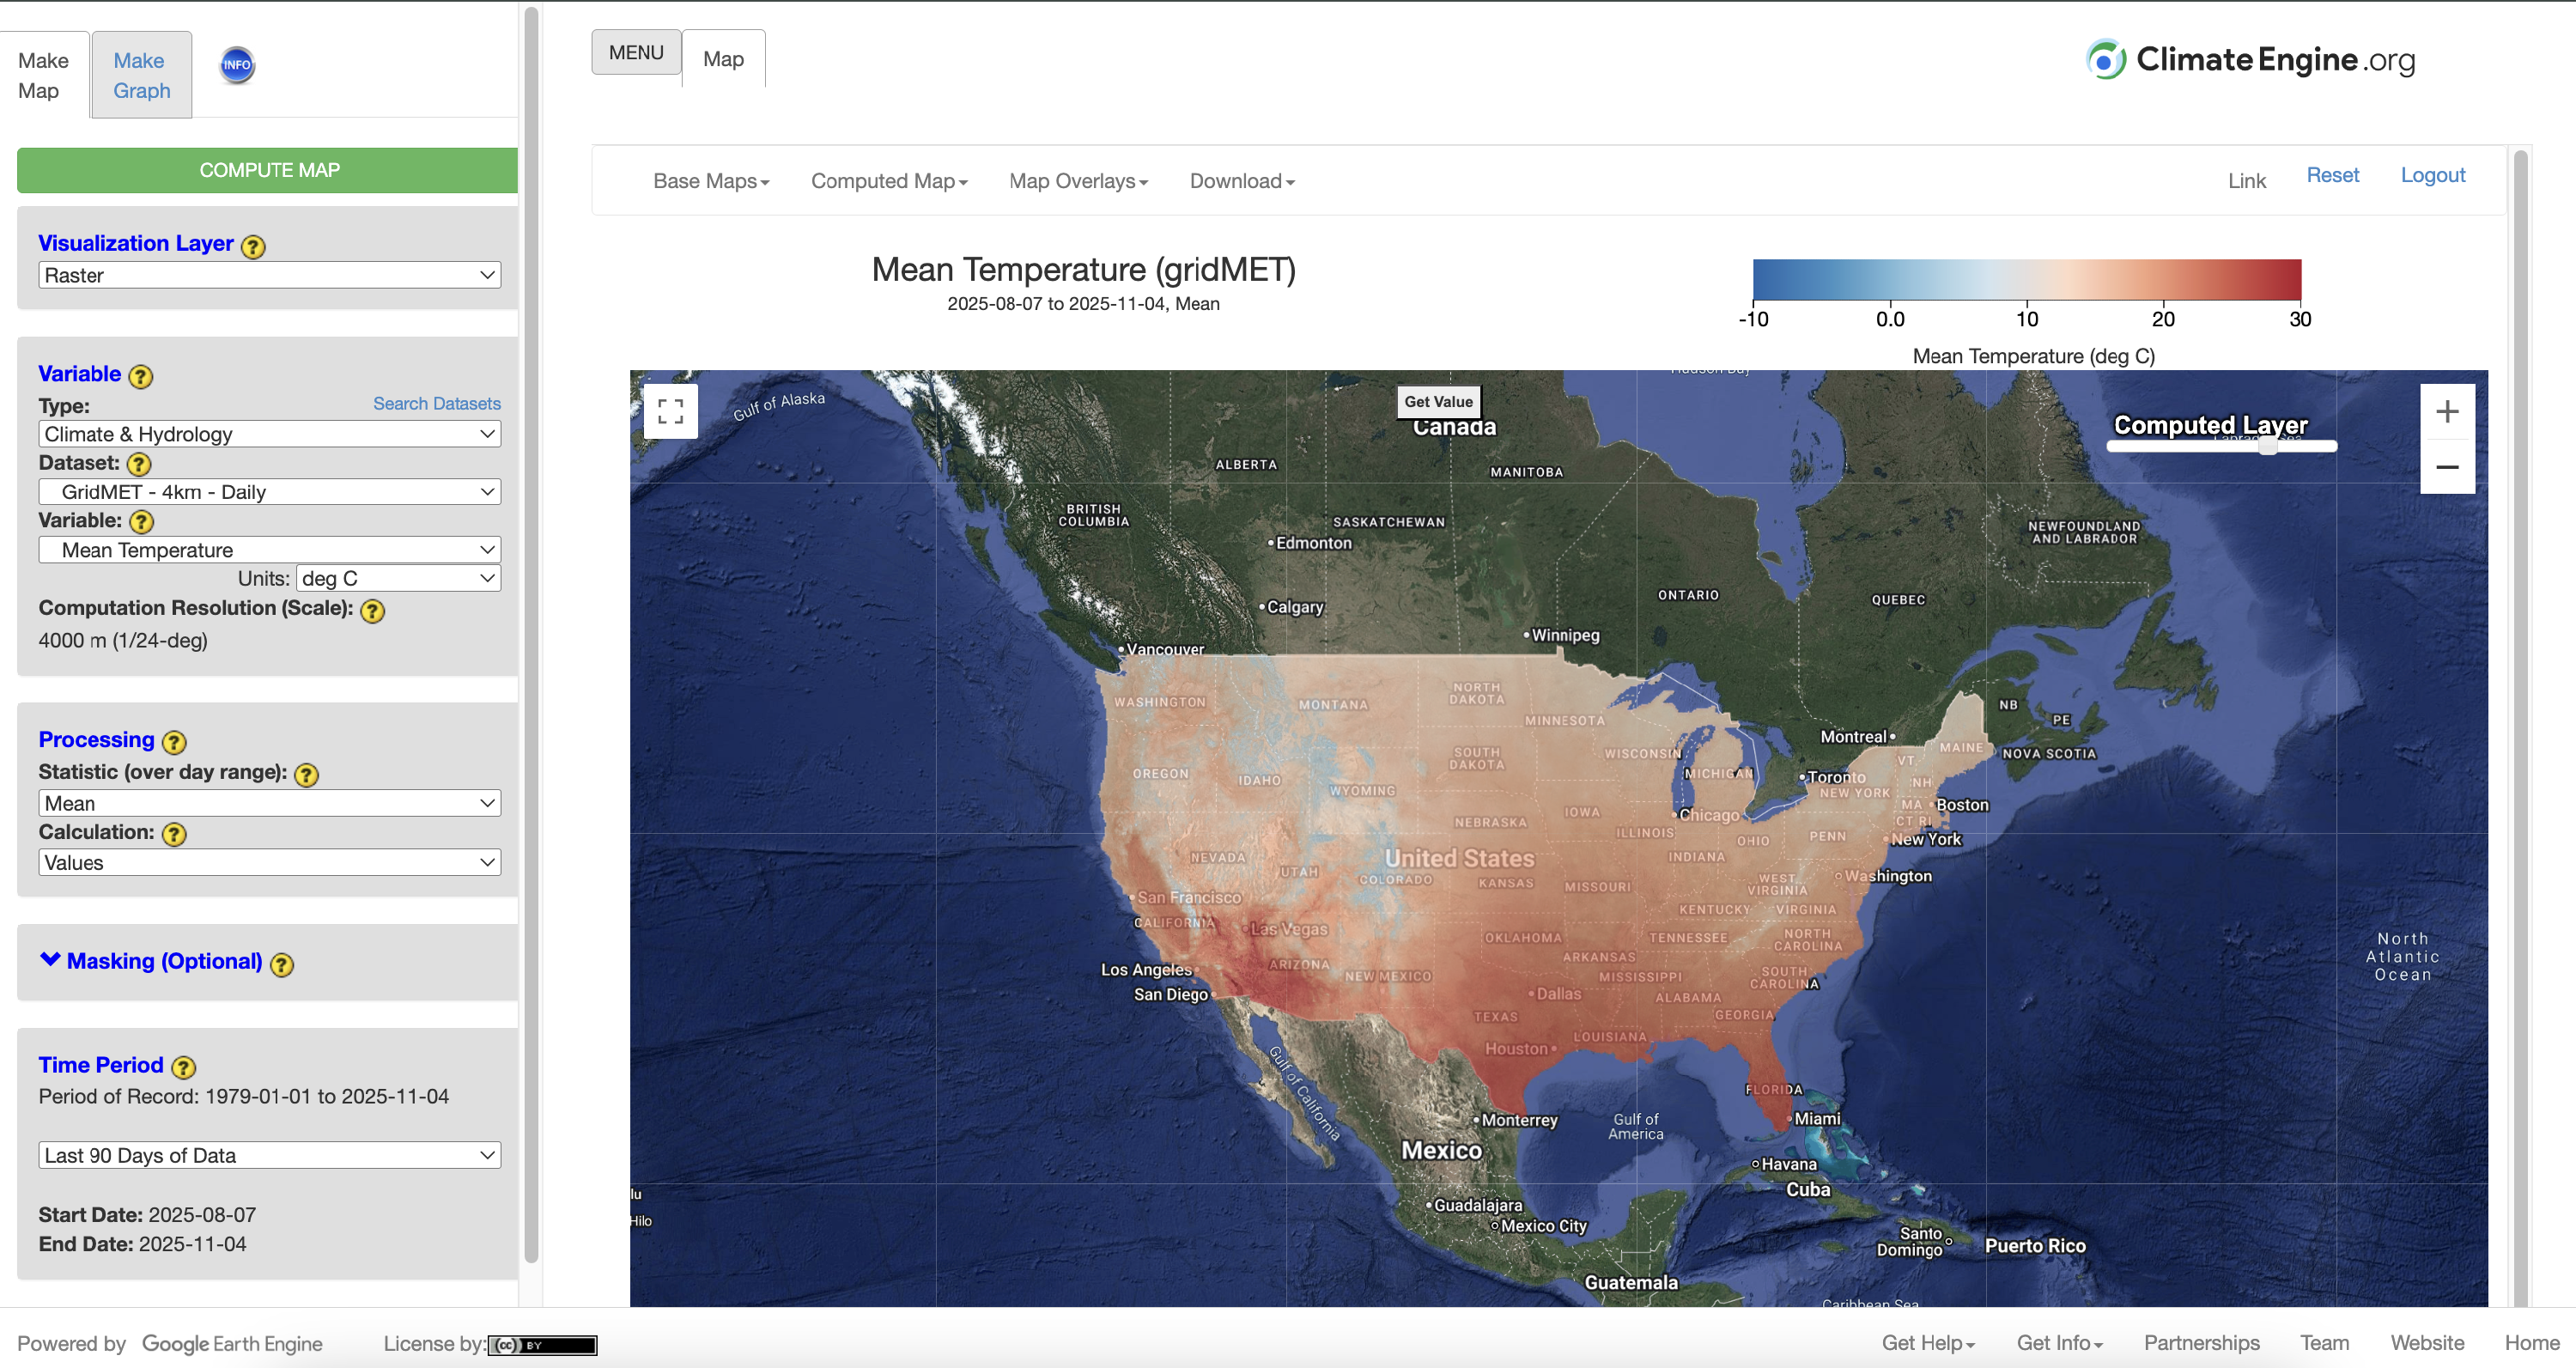
Product Selections for Map Requests
In Climate Engine, selecting your product first requires selecting a product type from amongst: Climate & Hydrology, Remote Sensing, Hazards, Forecasts, and Atmosphere. To Search the datasets, click the Search Datasets text to the right of the Type: dropdown title. This opens a searchable spreadsheet in another tab.

Once the product type is selected, the different datasets available of each type will be populated in the Dataset dropdown. Once the dataset is selected, the different variable metrics available under the dataset will be populated in the Dataset dropdown.
Processing Options for Map Requests
Climate Engine allows you to select what you precisely want to display in the summary maps. The processing options available for the selected dataset are split into two categories: Statistic (over day range) and Calculation.

Under the Calculation category, you have the options of:
- Values: These are actual values of the variable in either the raw units or the transformed units.
- Average Conditions: These are averages of the values over the time period and over the specified years. When this option is selected, a dropdown for ‘Year Range for Historical Average’ will appear for selection of the years to go into the average calculation.
- Difference from Average Conditions: These are differences of ‘Values’ from ‘Average Conditions’ . When this option is selected, a dropdown for ‘Year Range for Historical Average’ will appear for selection of the years to go into the average calculation.
- Percent Difference from Average Conditions: These are calculated as the difference of ‘Values’ from ‘Average Conditions’ divided by ‘Average Conditions’ and then multiplied by 100 to cast as a percent. When this option is selected, a dropdown for ‘Year Range for Historical Average’ will appear for selection of the years to go into the average calculation.
- Percent of Average Conditions: These are calculated as the ‘Values’ divided by the ‘Average Conditions’ multiplied by 100 to cast as a percent. When this option is selected, a dropdown for “year Range for Historical Average” will appear for selection of the years to go into the average calculation.
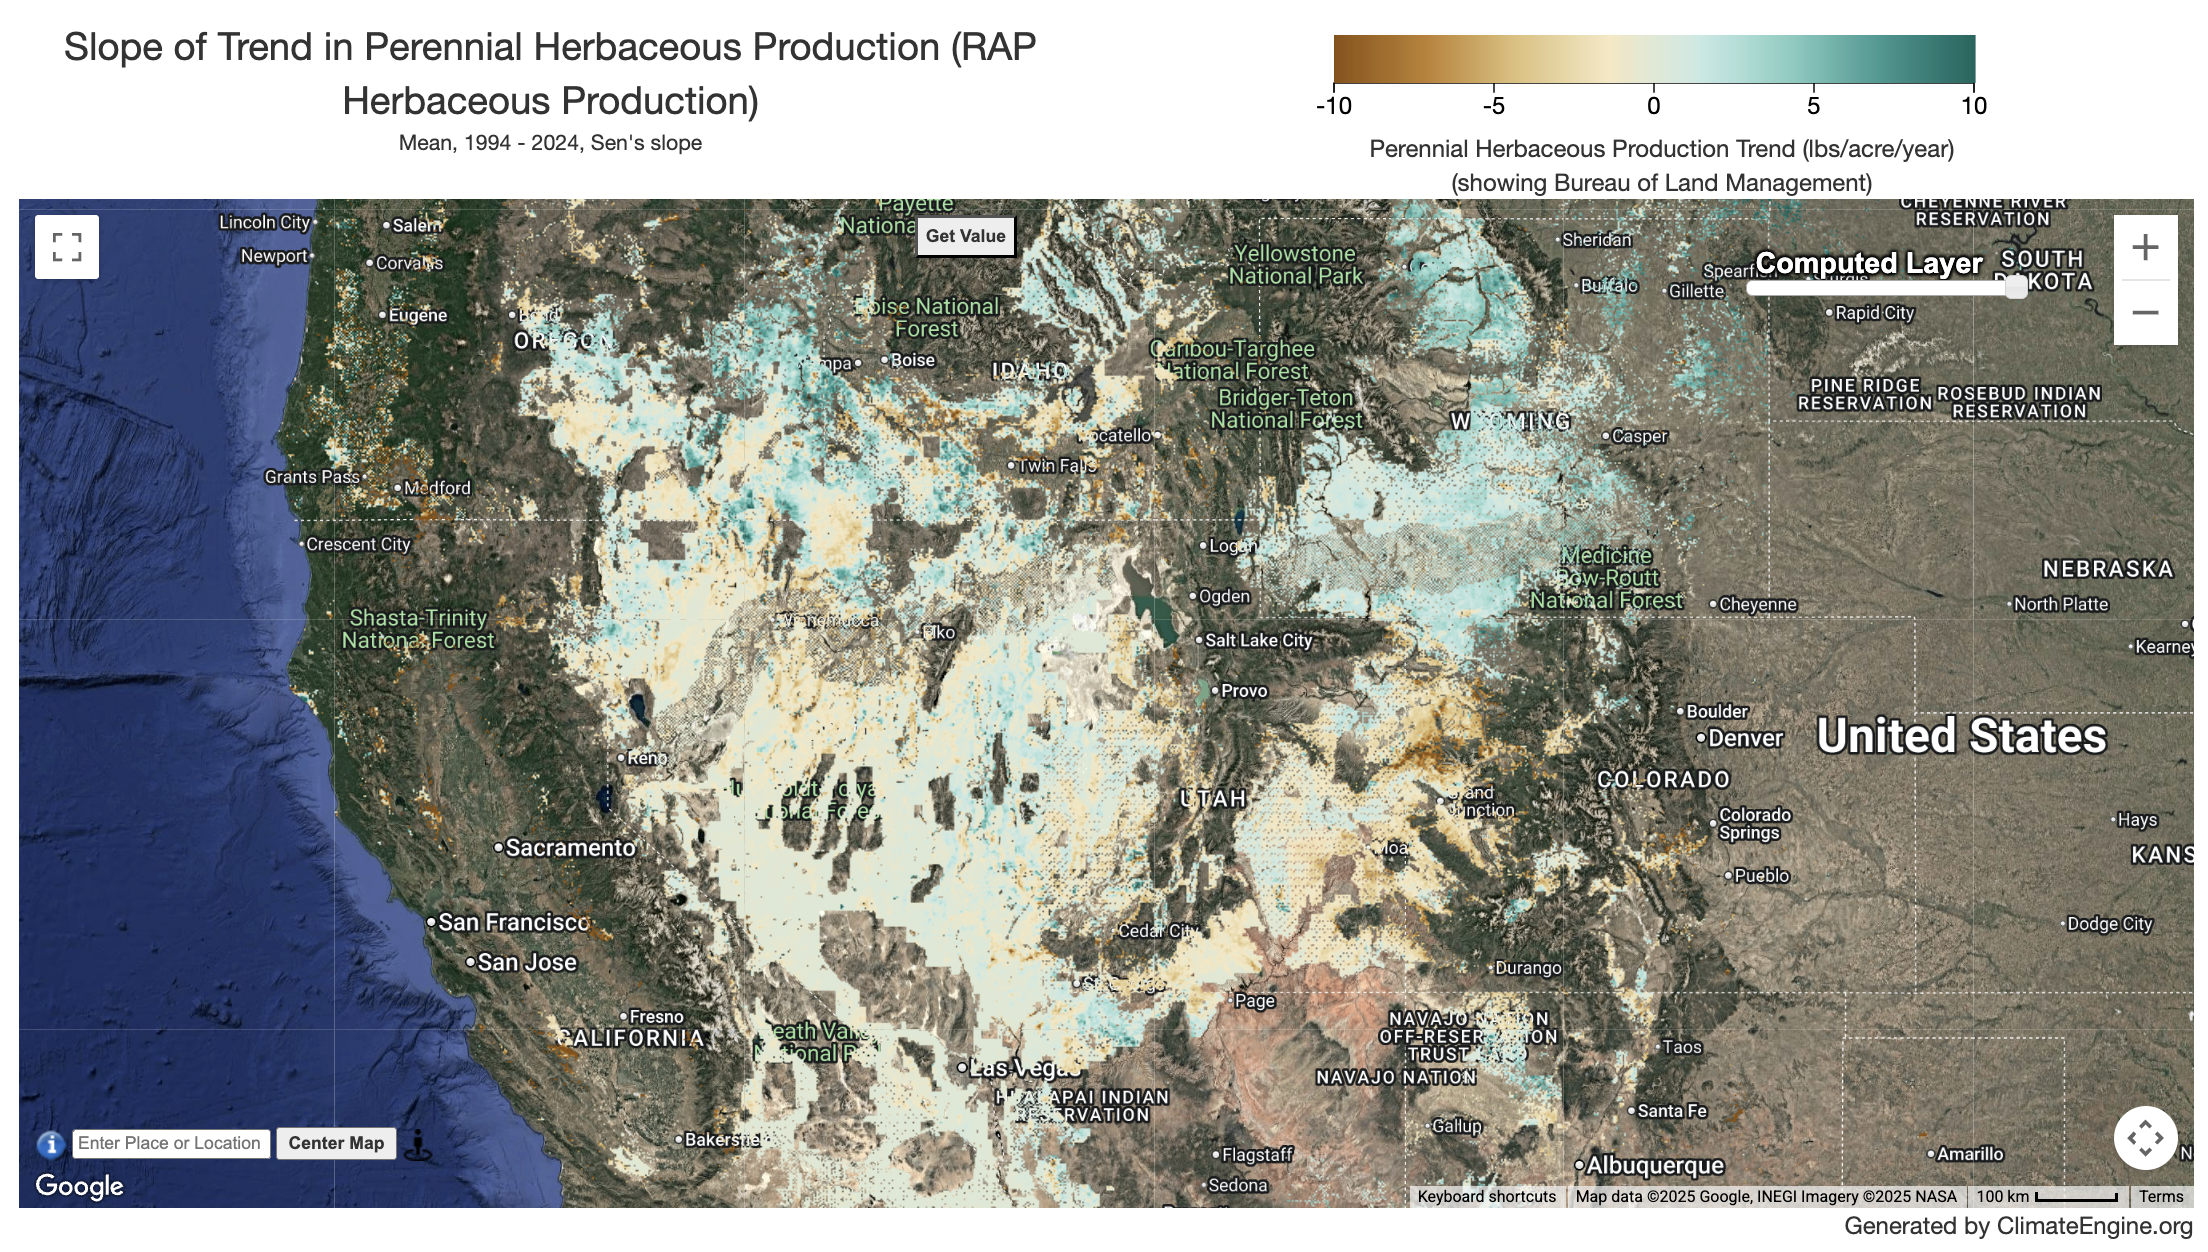
- Slope of Trend (Sen's Slope): These are calculated as the non-parametric trend (Sen’s slope) of the selected dataset and variable over the time period selected using the “Year Range for Historical Avg/Distribution” dropdown menus. When this option is selected, a dropdown for selecting the date range and a dropdown for ‘Year Range for Historical Avg/Distribution’ will appear for selecting the years to go into the slope of trend calculation.
- Mann-Kendall p-value mask: A dropdown of various p-values is provided for this calculation. It allows you to mask (remove from your map) areas that don't meet a certain confidence level statistically.
- Correlation of Trend (Kendall Tau-b): These are calculated as the Kendall’s Tau-b rank correlation, with a positive tau value indicating an increasing trend and a negative value indicating a decreasing trend. When this option is selected, a dropdown for selecting the date range and a dropdown for ‘Year Range for Historical Avg/Distribution’ will appear for selecting the years to go into the correlation of trend calculation.
- Mann-Kendall p-value mask: A dropdown of various p-values is provided for this calculation. It allows you to mask (remove from your map) areas that don't meet a certain confidence level statistically.
- Percentile in Distribution of Past Observations: These are calculated as ranked values over the time period relative to the ‘Year Range for Historical Distribution’, with values close to 100 being among the highest values on record and values close to 0 being among the lowest years on record for the variable selected. When this option is selected, a dropdown for ‘Year Range for Historical Average’ will appear for selection of the years to go into the average calculation.
- Standardized Index: These are calculated as the standardized departure from the selected probability distribution function for the time period for the date range selected relative to the years selected using the ‘Year Range for Historical Avg/Distribution’ dropdown menus. When this option is selected, a dropdown for selecting the distribution will appear for selection and a dropdown for ‘Year Range for Historical Average’ will appear for selection of the years to go into the average calculation.
- Non-parametric: Probability distribution estimated using non-parametric Tukey plotting positions.
- Gamma: Probabilities estimated using a parametric gamma distribution.
- Log-logistic: Probabilities estimated using a parametric log-logistic distribution.
Under the "statistic (over day range) category, you have the options of:
- Total: Calculates the sum of all values at each pixel across the stack of all matching bands.
- Mean: Calculates the mean of all values at each pixel across the stack of all matching bands.
- Median: Calculates the median of all values at each pixel across the stack of all matching bands.
- Minimum: Calculates the minimum value of each pixel across the stack of all matching bands.
- Maximum: Calculates the maximum value of each pixel across the stack of all matching bands.
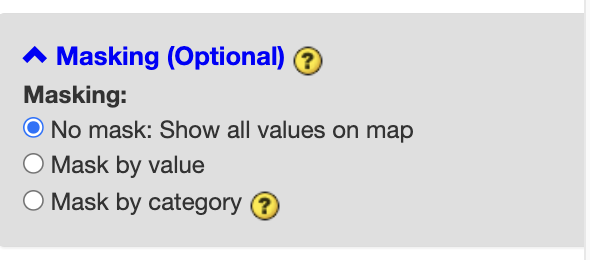
Optional Masking
Climate Engine allows you to mask the map outputs . The masking options available for the selected dataset are split into two categories: Mask by value and Mask by Category. You can only choose one type of masking at a time.
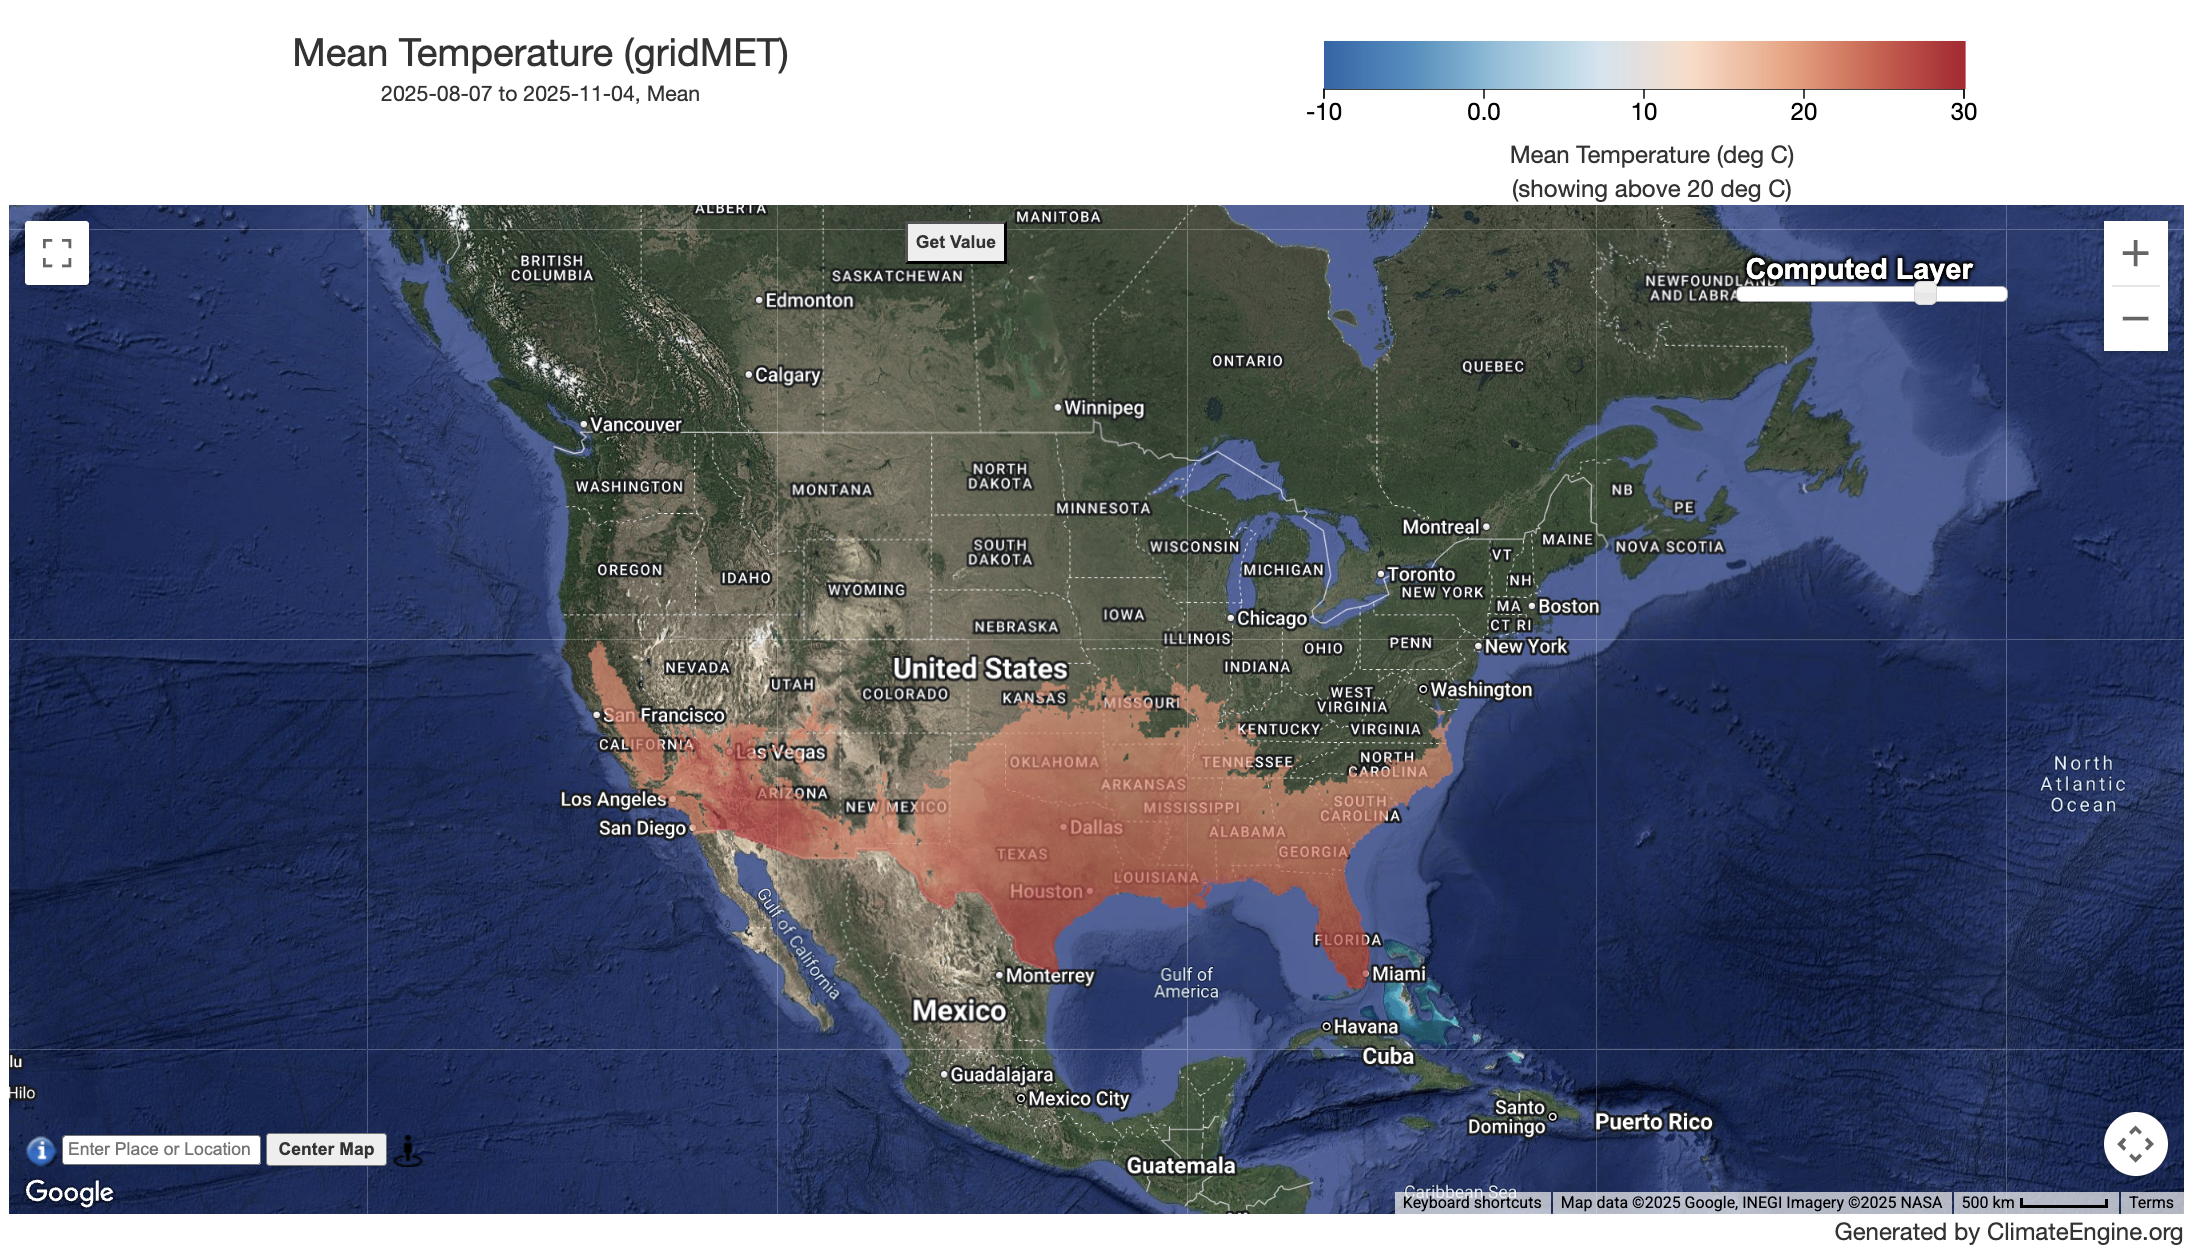
Mask by Value
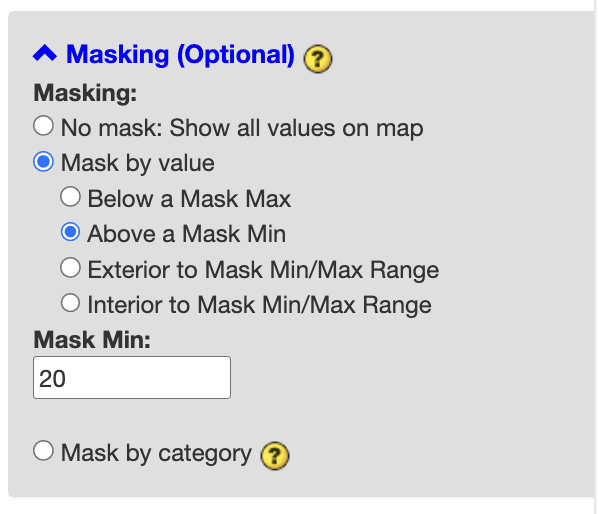
This option allows you to select a threshold and provide values to mask the map by. For example, selecting the Above a Mask Min and typing in 20 for Mask Min only shows mapped values that are above 20 deg C.
Mask by category
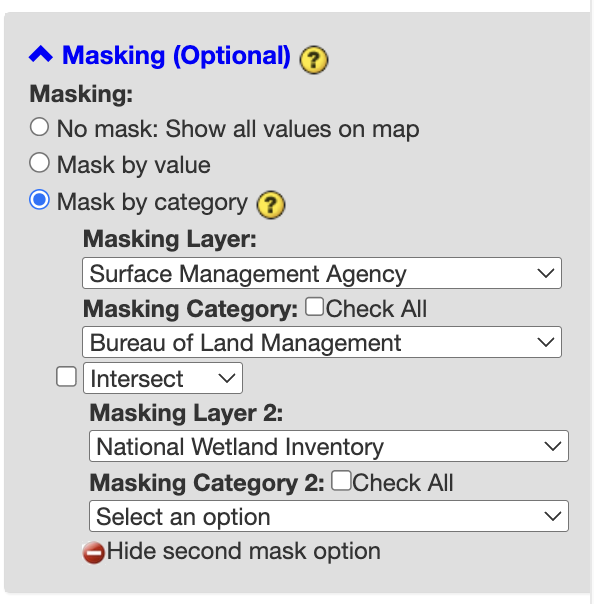
This options allows you to subset your computed map layers based on categorical datasets such as land ownership, landcover, or wetland types. When you select this option, you are provided two drop-down menus. The first drop-down, Masking Layer, lists the masking layers you can select from. Once a masking layer is selected, the Masking Category drop-down will be populated with the categories to select from. Multiple categories can be selected and the resulting mask will be a union of those categories. If you are interested in all available categories you can click the Check All box. Then you can fill out the rest of the mapping panel as usual and click Compute Map. The computed layer will be added to the map.
There is the option to combine the first mask with a second mask by either taking a union of the two masks or intersection of the two masks. To do this, click the (+) Show second mask option. Check the box next to the Intersect/Union dropdown and choose the type of join between the two masks. Intersect will result in showing areas that are categories selected for mask 1 AND categories selected for mask 2, e.g. areas that are BLM lands and Valley Bottom. Union will result in showing areas that are categories selected for mask 1 OR categories selected for mask 2, e.g. areas that are Riverine (NWI) and Valley Bottom. To go back to one mask, uncheck the Intersect/Union dropdown between the Masking Layers and select the Hide second mask option text that is now shown.
See a video example for this functionality below
Time Period Selection for Map Requests
Climate Engine allows you to specify the time period you want to use for the time series. In this section of the data request tab, you will select a date range from the dataset to perform the above processing upon. The period of record is available above the date selection dropdown.

The first option you have is to select a general time period you would like to look at, such as the last 60 days. The date range will be automatically populated for you. Second, if you would like to manually enter or adjust your date range, first select custom and then manually enter your date range via the text boxes or the calendar function.
Submitting Map Requests
Once you have Selected the product, processing, and time period, you can click the green button COMPUTE MAP to submit your request to get a map. Once you do this, a window will popup letting you know that the site is working to get your map. For some requests, the map may appear quickly.
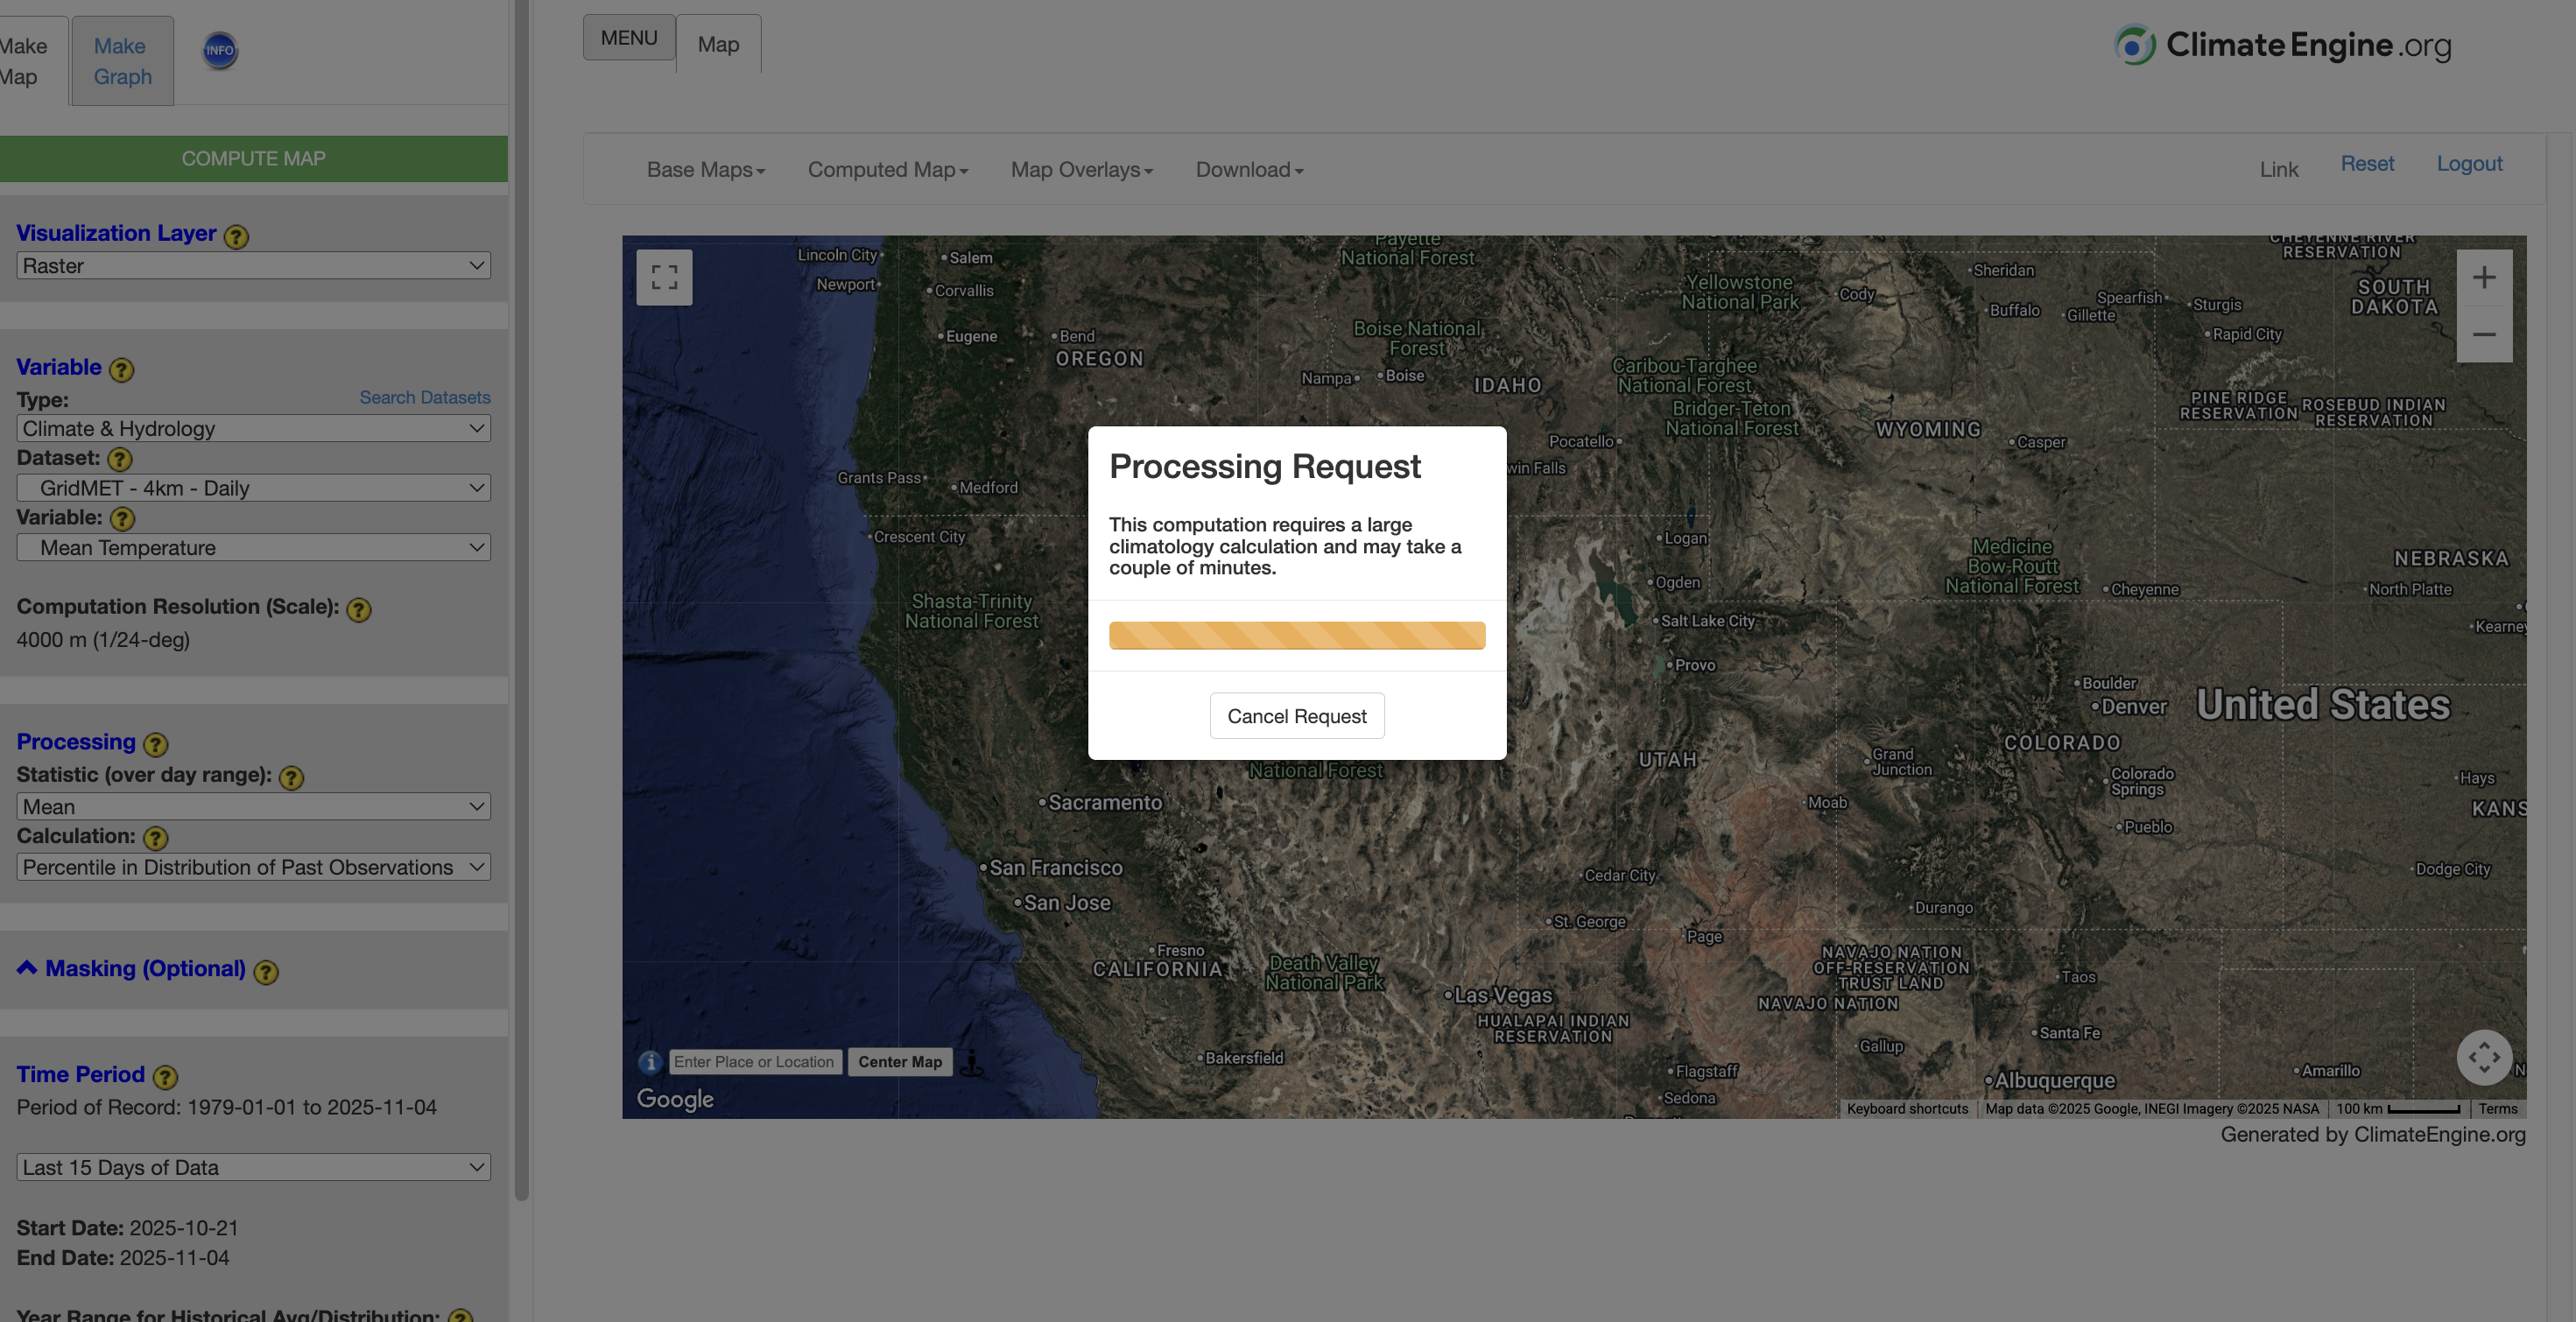
For other requests (i.e. those that require a statistic from many years of data such as the average climatology), it will take awhile for the map to appear and then it may come in tiles.
Note that after you have a map, additional zooming in or re-centering of the map will cause recalculation of the map. For most zooms, such recalculations will take about the same amount of time as the first as Google only calculates to the resolution specified by your current zoom and view. Therefore, to speed up the calculation of your desired map, it is ideal for you to zoom in and center the map on your desired location before submitting your request.
Getting Map Values
Once you have produced your map, the Get Value button will appear in the upper center of the map. You won’t see this button initially with the tool. You can use this button to find out the value of your map at a specific location. To do this, click on the Get Value button in the upper center of the map and a point marker with an info box will appear in the center of the map.

To move the marker to your desired location, you can (1) Drag the point marker to your desired location and (2) Enter in the latitude(Lat) and longitude(Lon) coordinates of your desired location in the info box attached to the point marker. When you do (1), the latitude(Lat)/longitude(Lon) of your location should be updated in the info box. When you do (2), the point marker should jump to the location you entered. Note that the longitude should be entered as a negative value between -180 and 0 in the Western Hemisphere.

When you have selected your location, you should click the SHOW VALUE button in the info box to request the value. Unfortunately, this is somewhat of a slow process, where it may take awhile for the value to come back, depending on the nature of the calculation. A window should show up giving you indication that the calculation is still being made. When the window disappears, the info box should be updated with the latitude/longitude and value at the desired location.
 Go to the next article Exporting & Sharing a Map.